一 概述
从 Zookeeper 3.6.0 版本开始已经内置 Prometheus Client,通过配置可以通过 /metrics 接口进行暴露给 Prometheus 进行监控。
Notes: 参考 《ZooKeeper Monitor Guide》
二 启用
2.1 备份配置文件
# 注:我的环境的路径是 /etc/zookeeper/zoo.cfg
cp /etc/zookeeper/zoo.cfg /etc/zookeeper/zoo.cfg-$(date +'%s')
2.2 启用 PrometheusMetricsProvider 类
# 编辑 zoo.cfg,并添加以下内容
vim /etc/zookeeper/zoo.cfg

## 启用 Prometheus类
metricsProvider.className=org.apache.zookeeper.metrics.prometheus.PrometheusMetricsProvider
## 定义侦听的端口
metricsProvider.httpPort=4888
2.3 重启 Zookeeper 服务
# 我的 Zookeeper 服务是使用 systemd 进行托管,进行可以直接使用 systemctl 进行重启
systemctl restart zookeeper.serivce

# 如果是用 zkServer.sh 启动服务的,可以:
./zkServer.sh restart
三 检查
正常启动没有问题后,可以请求 http://<IP地址>:4888/metrics 地址,应该会返回相关的 Prometheus 指标:
curl http://localhost:4888/metrics


# 返回如下:
# HELP learner_request_processor_queue_size learner_request_processor_queue_size
# TYPE learner_request_processor_queue_size summary
learner_request_processor_queue_size{quantile="0.5",} NaN
learner_request_processor_queue_size_count 0.0
learner_request_processor_queue_size_sum 0.0
# HELP response_packet_cache_hits response_packet_cache_hits
# TYPE response_packet_cache_hits counter
response_packet_cache_hits 0.0
# HELP read_commit_proc_req_queued read_commit_proc_req_queued
# TYPE read_commit_proc_req_queued summary
read_commit_proc_req_queued{quantile="0.5",} NaN
read_commit_proc_req_queued_count 0.0
read_commit_proc_req_queued_sum 0.0
四 接入 Prometheus
4.1 接入采集
当环境中有部署 Prometheus 时, 可以按以下方式把 Zookeeper 进行接入:
# 1. 编辑 prometheus.yaml 文件,在 scrape_configs 下添加:
scrape_configs:
  - job_name: "zookeeper"
    static_configs:
      - targets: ["10.0.0.1:4888"]

# 2. 热重载 Prometheus
curl -XPOST http://localhost:9090/-/reload
Notes:
Prometheus 的热加载需要先定义启动参数--web.enable-lifecycle
4.2 接入告警
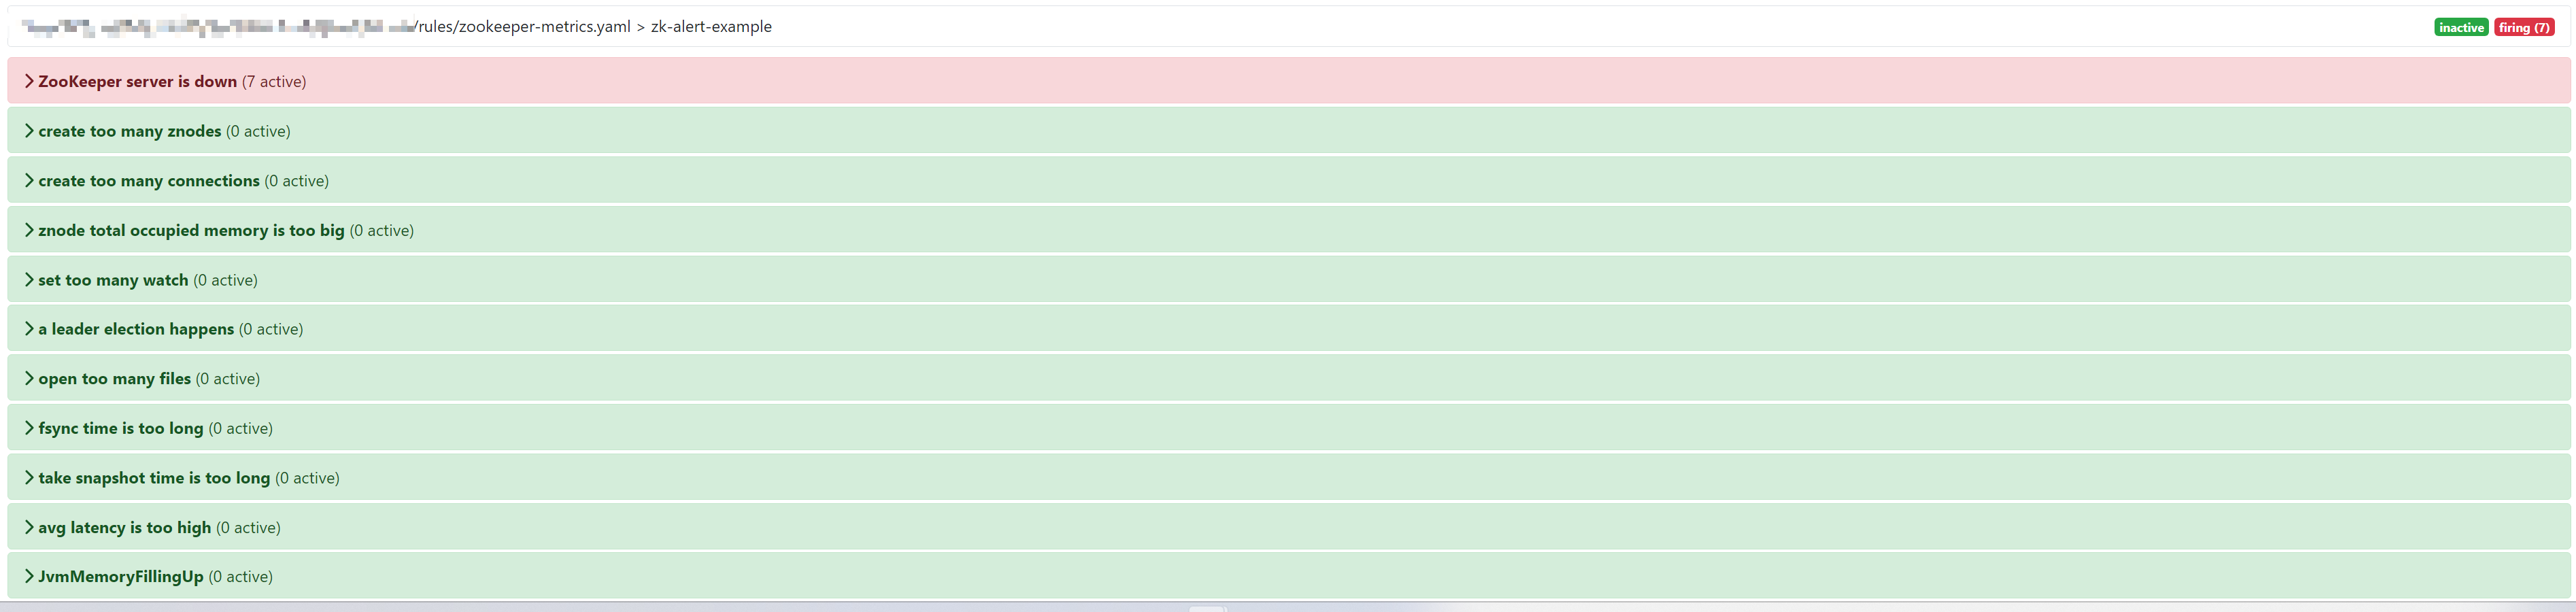
同时,Zookeeper 官方提供了基于 Prometheus 的告警规则示例,可以直接通过添加 zk.yaml 文件到 Prometheus 的 rules 路径下,以配置告警:
groups:
- name: zk-alert-example
  rules:
  - alert: ZooKeeper server is down
    expr:  up == 0
    for: 1m
    labels:
      severity: critical
    annotations:
      summary: "Instance {{ $labels.instance }} ZooKeeper server is down"
      description: "{{ $labels.instance }} of job {{$labels.job}} ZooKeeper server is down: [{{ $value }}]."

  - alert: create too many znodes
    expr: znode_count > 1000000
    for: 1m
    labels:
      severity: warning
    annotations:
      summary: "Instance {{ $labels.instance }} create too many znodes"
      description: "{{ $labels.instance }} of job {{$labels.job}} create too many znodes: [{{ $value }}]."

  - alert: create too many connections
    expr: num_alive_connections > 50 # suppose we use the default maxClientCnxns: 60
    for: 1m
    labels:
      severity: warning
    annotations:
      summary: "Instance {{ $labels.instance }} create too many connections"
      description: "{{ $labels.instance }} of job {{$labels.job}} create too many connections: [{{ $value }}]."

  - alert: znode total occupied memory is too big
    expr: approximate_data_size /1024 /1024 > 1 * 1024 # more than 1024 MB(1 GB)
    for: 1m
    labels:
      severity: warning
    annotations:
      summary: "Instance {{ $labels.instance }} znode total occupied memory is too big"
      description: "{{ $labels.instance }} of job {{$labels.job}} znode total occupied memory is too big: [{{ $value }}] MB."

  - alert: set too many watch
    expr: watch_count > 10000
    for: 1m
    labels:
      severity: warning
    annotations:
      summary: "Instance {{ $labels.instance }} set too many watch"
      description: "{{ $labels.instance }} of job {{$labels.job}} set too many watch: [{{ $value }}]."

  - alert: a leader election happens
    expr: increase(election_time_count[5m]) > 0
    for: 1m
    labels:
      severity: warning
    annotations:
      summary: "Instance {{ $labels.instance }} a leader election happens"
      description: "{{ $labels.instance }} of job {{$labels.job}} a leader election happens: [{{ $value }}]."

  - alert: open too many files
    expr: open_file_descriptor_count > 300
    for: 1m
    labels:
      severity: warning
    annotations:
      summary: "Instance {{ $labels.instance }} open too many files"
      description: "{{ $labels.instance }} of job {{$labels.job}} open too many files: [{{ $value }}]."

  - alert: fsync time is too long
    expr: rate(fsynctime_sum[1m]) > 100
    for: 1m
    labels:
      severity: warning
    annotations:
      summary: "Instance {{ $labels.instance }} fsync time is too long"
      description: "{{ $labels.instance }} of job {{$labels.job}} fsync time is too long: [{{ $value }}]."

  - alert: take snapshot time is too long
    expr: rate(snapshottime_sum[5m]) > 100
    for: 1m
    labels:
      severity: warning
    annotations:
      summary: "Instance {{ $labels.instance }} take snapshot time is too long"
      description: "{{ $labels.instance }} of job {{$labels.job}} take snapshot time is too long: [{{ $value }}]."

  - alert: avg latency is too high
    expr: avg_latency > 100
    for: 1m
    labels:
      severity: warning
    annotations:
      summary: "Instance {{ $labels.instance }} avg latency is too high"
      description: "{{ $labels.instance }} of job {{$labels.job}} avg latency is too high: [{{ $value }}]."

  - alert: JvmMemoryFillingUp
    expr: jvm_memory_bytes_used / jvm_memory_bytes_max{area="heap"} > 0.8
    for: 5m
    labels:
      severity: warning
    annotations:
      summary: "JVM memory filling up (instance {{ $labels.instance }})"
      description: "JVM memory is filling up (> 80%)\n labels: {{ $labels }}  value = {{ $value }}\n"
接入后即可以 Prometheus 的 Alerts 页面看到如下策略:
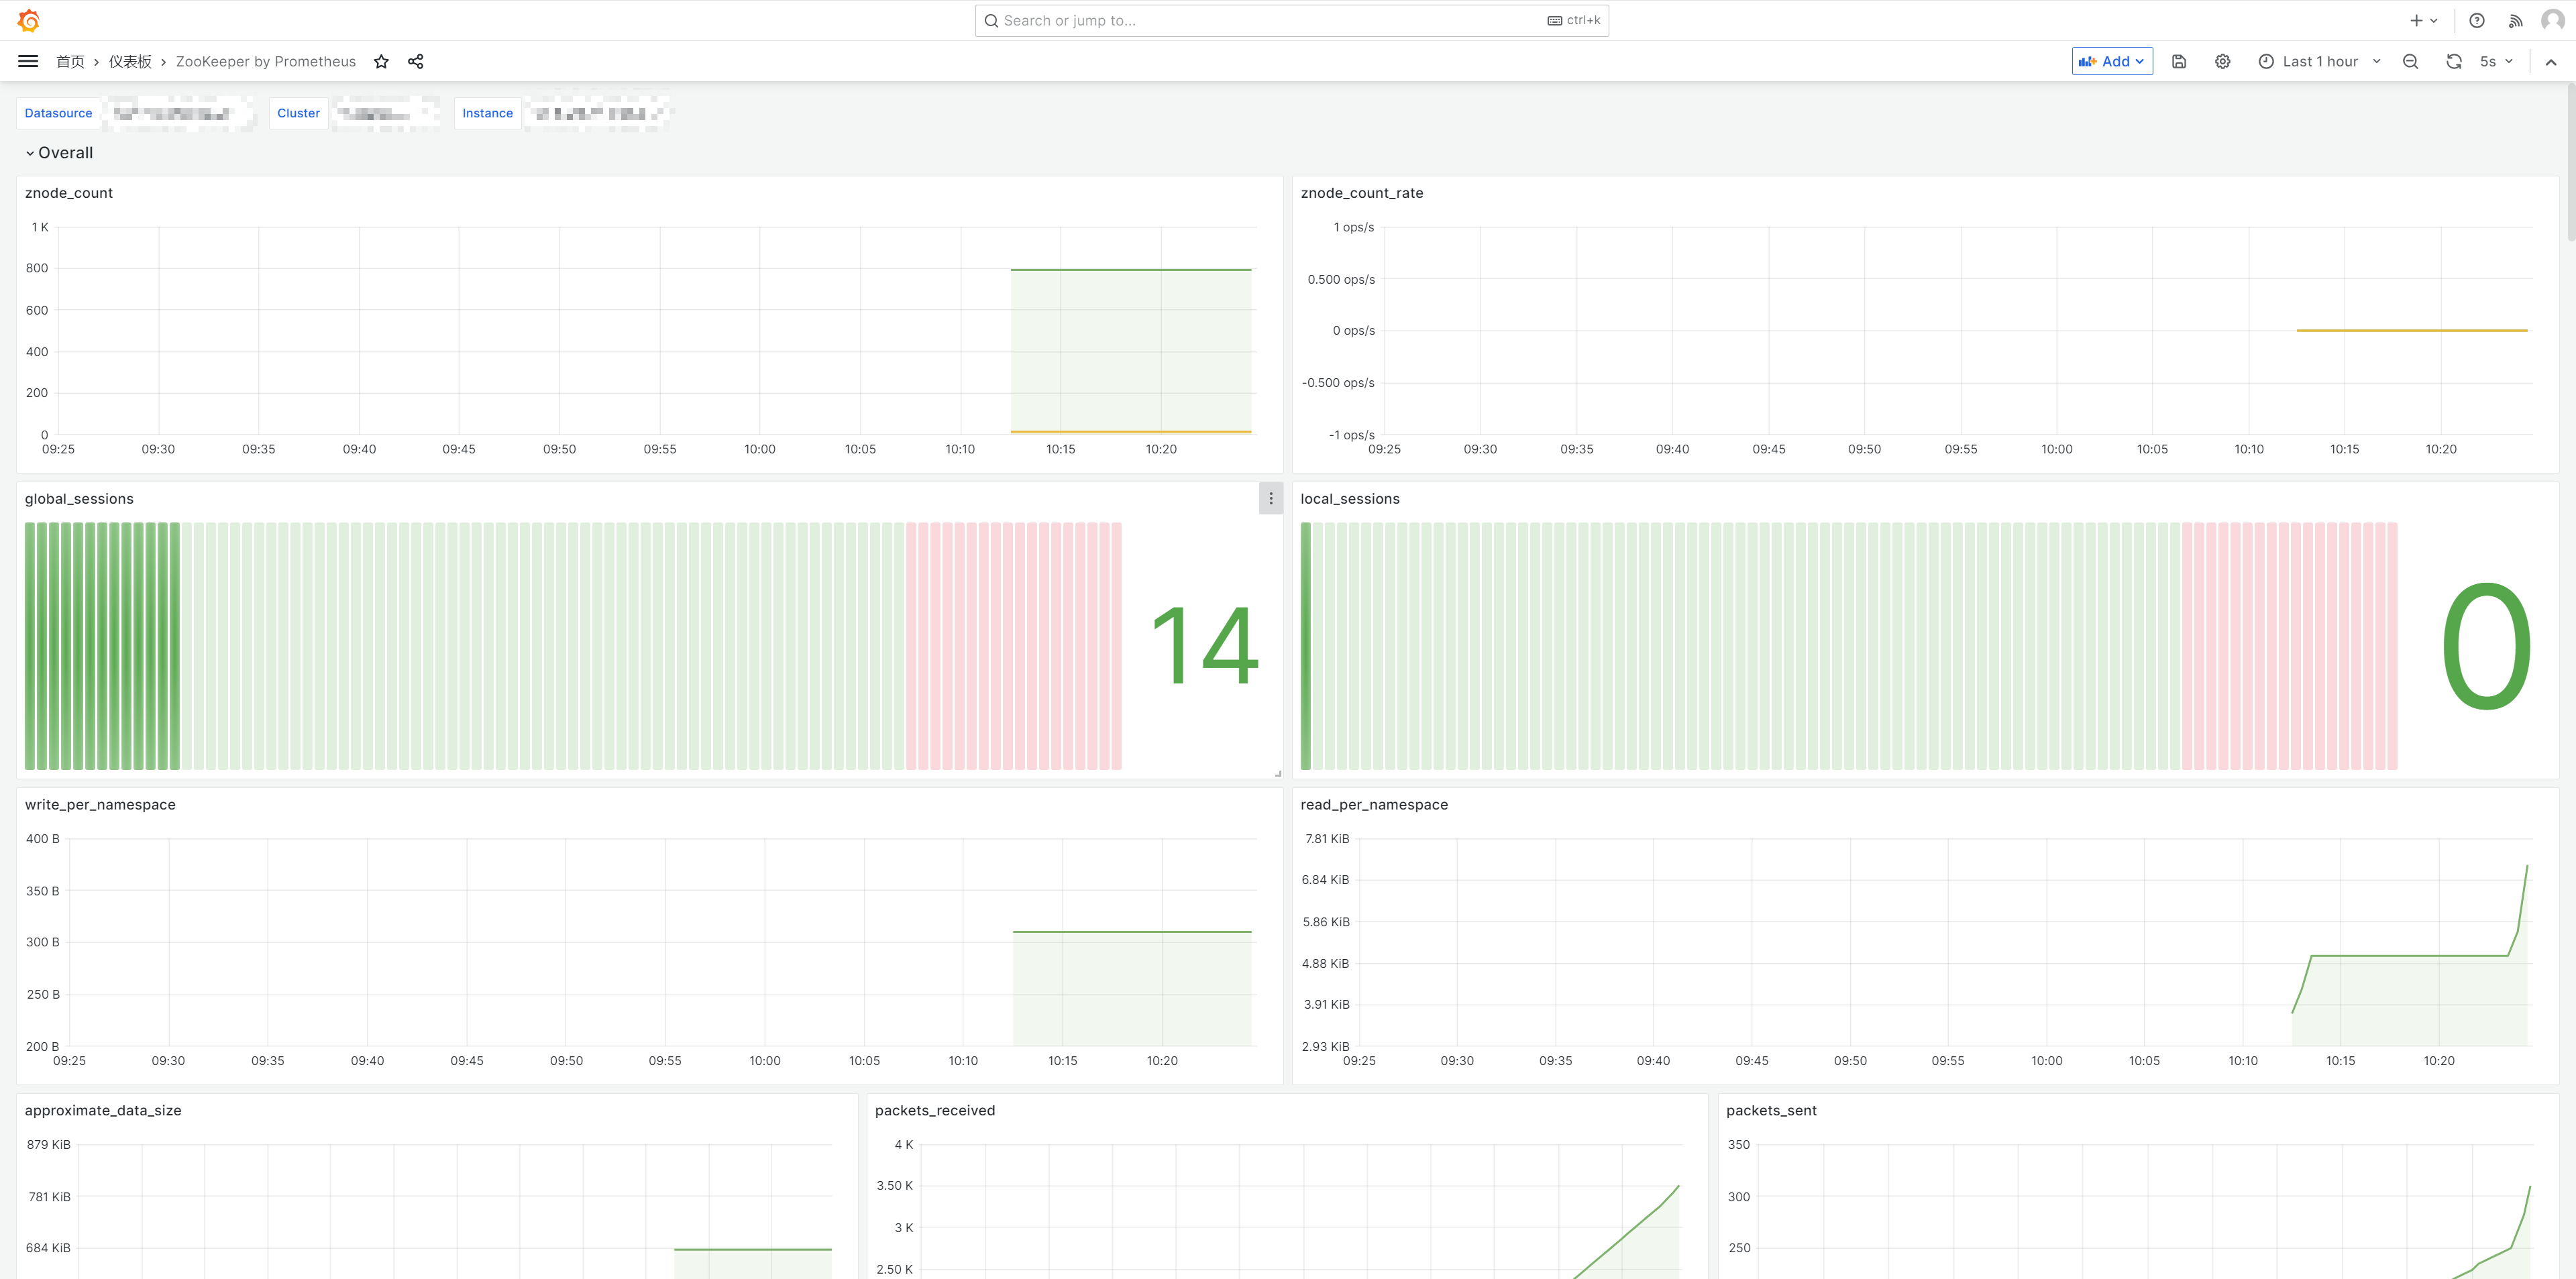
五 配置 Grafana 视图
同样,Zookeeper 也提供了对应的 Grafana 视图 ZooKeeper by Prometheus,导入后即可看到下以 Dashboard: